HomeNews
Why is England fly-tipping? New research reveals all
Why is England fly-tipping? New research reveals all
In the wake of new fly-tipping statistics released by the Department for Environment, Food and Rural Affairs, also known as DEFRA, we have spoken to 2,000 members of the public to understand what is driving England’s fly-tipping crisis.
For the year 2024 – 2025, the figures show that local authorities in England dealt with 1.26 million fly-tipping incidents, an increase of 9% from the previous year.
To understand more about what is fuelling this crisis, we have combined new public opinion research we commissioned along with analysis of both Defra and local authority data. Our analysis exposes the habits which may be contributing to this growing issue, as well as who the public feels are the ones driving it.
Alongside this, we have also examined the local authorities who are shouldering the greatest burden for fly-tipping and the economical struggle in their areas, as well as the number of fines issued for this crime. Furthermore, we have investigated whether fly-tipping is primarily an urban or rural issue, as we recognise the cause and solutions of this issue can significantly differ depending on the area.
Fly-tipping defined
Before we get into the data, we want to recap what fly-tipping is. The Neighbourhood Watch, the largest volunteer-led crime prevention charity in England and Wales, defines fly-tipping as ‘the illegal dumping of waste onto or into land that is not licensed to receive it. The type and quantity of the waste involved can be wide-ranging in nature, including anything from a single black bag of household waste through to trailer-loads of commercial or construction materials.’
It’s clear that fly-tipping is a growing issue here in the UK, so we wanted to explore whether the public understands which actions constitute to fly-tipping, and whether gaps in awareness and education might be contributing to this problem.
How does the public dispose of their waste?
We asked 2,000 adults who are representative of the population a series of questions to understand their waste disposal habits.
Over 1 in 6 (17%) members of the public admit to leaving unwanted waste (bags of waste, furniture, DIY materials or electricals) next to an overflowing or full bin
Men (18%) are more likely than women (16%) to leave unwanted waste next to a bin
Those aged 25 – 34 years old (generation Z and millennials) are the worst offenders, with 34% admitting to fly-tipping by leaving rubbish next to an overflowing or full bin
Our next question focuses on whether the public has left an item beside a bin, hoping someone else (for example, the local council) would collect this item.
Almost 1 in 5 people (19%) admitted to leaving an item next to a bin, hoping someone else would collect this item
1 in 11 people (9%) told us they were not sure or would prefer not to say
Residents in rural areas (21%) are more likely to leave items vs residents in urban areas (20%) or suburban areas (16%)
If you can’t dispose of your own waste correctly, whether at home or for a business, you may find yourself in a position where you need to hire someone to collect it. Part of the UK’s fly-tipping issue is the use of illegal waste collectors who operate without a proper licence. Recent research from Material Focus estimates that 63% of businesses and 238,741 individuals or organisations in England are offering to handle waste when their services appear to be unregistered. When comparing rates to similar sectors where a licence is required, for example, a TV licence, car tax evasion or gas safety, these rates typically fall between 1% – 8%, so these findings are truly stark.
We wanted to know whether UK residents have ever used a waste collector without checking if they are properly licensed.
Nearly 1 in 5 (18%) of people we spoke to admitted to doing this
1 in 3 residents in Northern Ireland (34%) also said yes, by far the most by of any other region
Almost one-third (30%) of those we spoke to who admitted to this hold a Director title, and over a quarter (27%) hold a senior manager title at the company they work for
Those aged 25 – 34 years old are the age group who admitted to not checking licences for waste carriers the most (28%), followed by those aged 35 – 44 years old (24%)
Our analysis exposes even more shocking patterns by those responsible for arranging the disposal of their commercial or business waste. We asked respondents whether they have ever arranged for their workplace waste to be disposed of without checking whether the collector is licensed:
Those with Director titles are the worst offenders, with 28% confessing to doing this, far above the average of other employment groups we spoke to
Almost 1 in 5 business owners (18%) have admitted to doing this
Workers in Glasgow are the most likely to do this than all other areas in the UK, with 15% admitting to doing so
We caught up with our Group Chief Commercial Officer, Kelvin Croney who shares why it is so important to check the credentials of a waste carrier when using their service:
“Our findings show that lack of awareness is a real driver for fly-tipping, and even experienced business leaders have been caught out. Part of the solution to the problem is simple: verify who handles your waste. Ensure collectors are licensed and following safe disposal practices that protect the community, environment, and ultimately your business.”
– Kelvin Croney, Group Chief Commercial Officer – Waste Managed
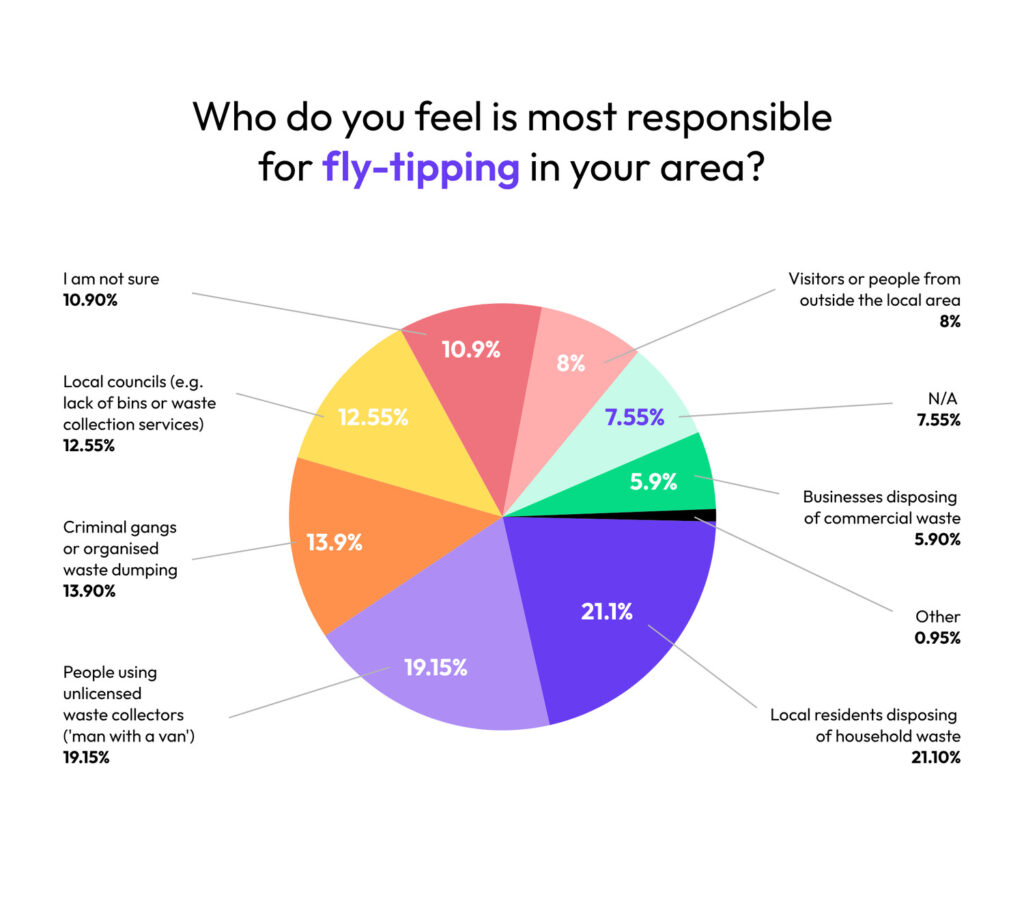
The next question we asked 2,000 members of the public was who they felt was most responsible for fly-tipping in their area.
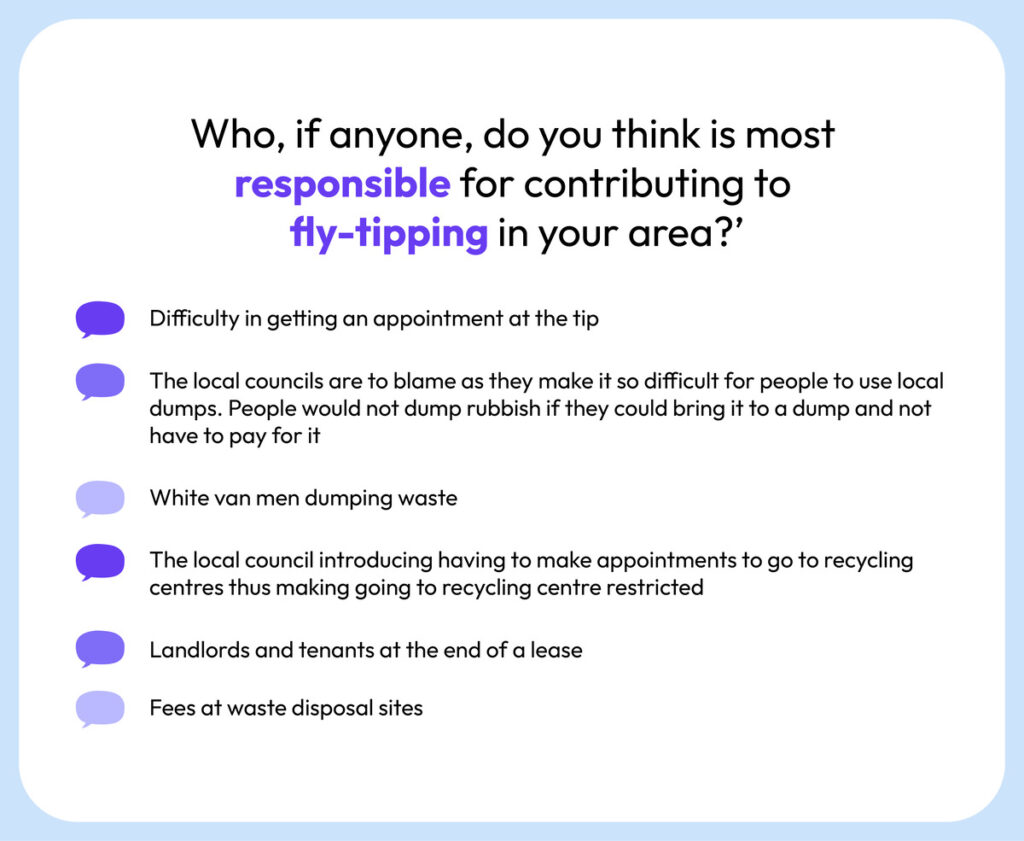
The open responses to our poll
Our poll suggests that the public feels there are multiple factors driving fly-tipping, with no single group standing out as a clear culprit. Local residents disposing of household waste are most frequently blamed, followed by unlicensed waste collectors and then by criminal gangs – who are often the focus of public discussion. These findings indicate that fly-tipping is not seen as a problem driven by one identifiable source, but an everyday issue involving a mix of behaviours and actors. The issue is complex and multi-faceted, with different solutions needed to address the issue, such as education, easier ways to dispose of waste and potentially more support from local authorities.
The Department for Environment, Food and Rural Affairs (Defra) recently released fly-tipping statistics for England for the years 2024 – 2025. We’ve crunched the numbers to see which areas of England have been most widely reported for fly-tipping, and which local councils are shouldering the biggest burden.
Before we get into the data, it’s important to note the following caveats highlighted by Defra:
The data is based on incidents and actions reported by each local authority.
Local authorities gather their data from a number of different sources, so there is a level of discretion in applying the reporting guidance.
The nature of fly-tipping does mean there can be a high variation between years and authorities, changes in data collection and reporting over time mean that trends should be reported with caution.
Fly-tipping is a complex issue and can be influenced by population density, housing stock, demographics and commuter routes. Authorities reporting higher numbers are often those being the most proactive in identifying incidents.
With these caveats in mind, our analysis highlights trends in the data, including the local authorities where incidents are most often reported. Our analysis is intended to show patterns and context rather than assign responsibility to a particular authority or community.
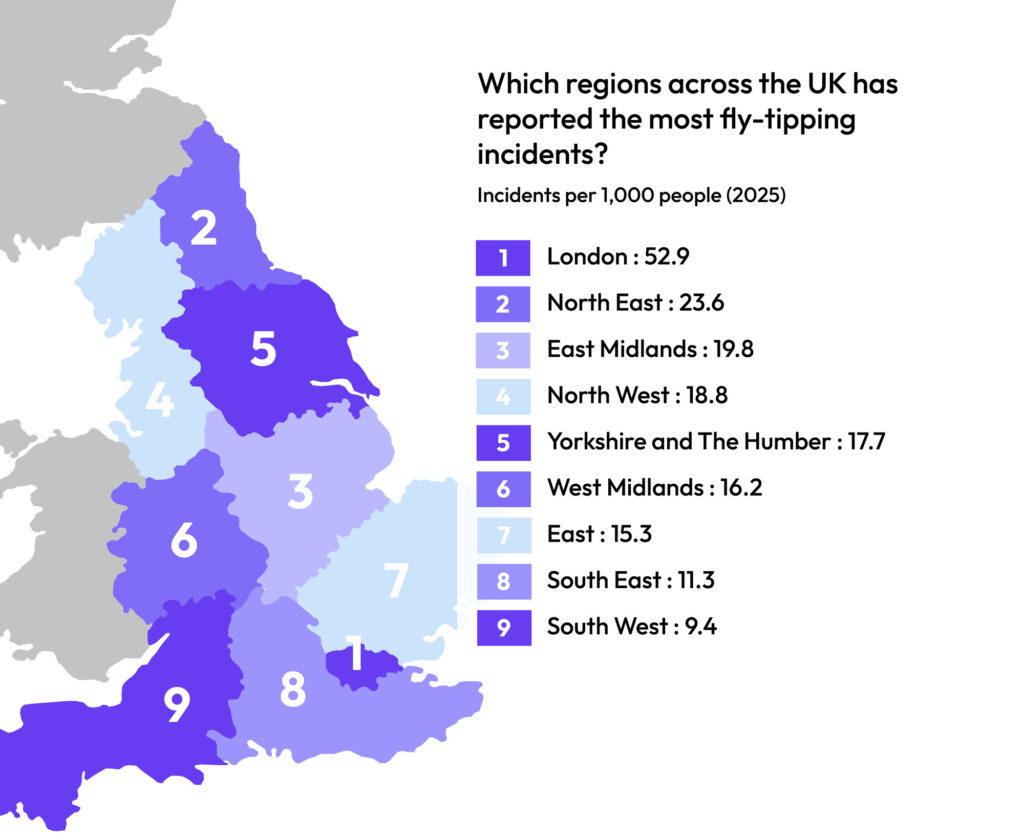
Which regions across the UK has reported the most fly-tipping incidents?
Local authorities in London have reported the highest number of fly-tipping incidents in the year 2025, over double the number than any other region. The North East of England comes in second, followed by the East Midlands. The data from Defra doesn’t say why there are more incidents reported across different regions, however it does show that the issue isn’t evenly distributed, possibly pointing to a postcode lottery where people living in different parts of the country are far more likely to be affected than others.
The local authorities reporting the most incidents ranked
Local authority
Incidents per 1,000 people (2025)
Camden
166.9
Croydon
130.1
Hackney
116.4
Lewisham
111.1
City of London
109.5
Westminster
95.5
Hounslow
84.1
Newham
70.8
Merton
68.1
Lambeth
67.0
Ealing
65.8
Haringey
64.1
Southwark
58.9
Greenwich
55.5
Kensington and Chelsea
52.7
Harrow
51.4
Brent
46.3
Hammersmith and Fulham
42.9
Waltham Forest
36.6
Barking and Dagenham
32.7
Hillingdon
29.9
Richmond upon Thames
28.5
Enfield
28.2
Redbridge
25.5
Bromley
20.8
Tower Hamlets
18.2
Sutton
18.1
Barnet
17.1
Wandsworth
16.5
Havering
16.4
Islington
14.9
Bexley
14.8
Kingston upon Thames
13.8
Local authority
Incidents per 1,000 people (2025)
Newcastle-upon-Tyne
52.2
Redcar and Cleveland
38.2
Darlington
34.2
Sunderland
32.9
Hartlepool
32.4
Gateshead
25.8
South Tyneside
22.7
North Tyneside
18.1
Middlesbrough
17.6
Stockton-on-Tees
11.8
Northumberland
10.9
County Durham
9.8
Local authority
Incidents per 1,000 people (2025)
Nottingham
78.9
Boston
65.9
West Northamptonshire
48.4
Lincoln
44.3
Derby
23.6
Leicester
17.9
South Holland
17.6
Mansfield
17.4
North Northamptonshire
15.5
West Lindsey
15.3
Bolsover
14.3
Bassetlaw
14.2
Newark and Sherwood
12.9
East Lindsey
11.0
Melton
9.9
Broxtowe
9.2
Rushcliffe
8.6
South Kesteven
8.2
North Kesteven
8.1
Ashfield
7.8
Hinckley and Bosworth
7.2
Blaby
6.6
Chesterfield
5.8
North East Derbyshire
5.5
Charnwood
5.4
North West Leicestershire
5.3
Rutland
5.2
South Derbyshire
4.8
High Peak
4.4
Derbyshire Dales
4.0
Gedling
3.4
Harborough
3.2
Amber Valley
2.2
Erewash
2.1
Oadby and Wigston
0.7
Local Authority
Incidents per 1,000 people (2025)
Pendle
62.0
Burnley
42.4
Liverpool
39.9
Blackpool
35.0
Preston
34.6
Hyndburn
30.6
Salford
25.9
Manchester
25.4
Bolton
24.4
Wirral
24.3
Oldham
23.7
Blackburn with Darwen
23.6
Rochdale
22.5
Lancaster
22.0
West Lancashire
17.4
Bury
16.2
Rossendale
15.1
Sefton
14.4
Knowsley
13.5
Tameside
13.4
Stockport
12.3
Cumberland
12.1
Ribble Valley
11.4
Cheshire West and Chester
10.8
Warrington
10.3
Trafford
9.7
Wigan
9.0
Cheshire East
9.0
Chorley
7.8
St Helens
7.2
Westmorland and Furness
6.7
Wyre
5.2
South Ribble
3.9
Halton
3.6
Local Authority
Incidents per 1,000 people (2025)
Kingston-upon-Hull
49.6
Bradford
34.9
Kirklees
22.6
Barnsley
21.5
Sheffield
21.0
Wakefield
18.9
Rotherham
18.8
Leeds
16.5
North East Lincolnshire
13.3
York
11.0
North Lincolnshire
7.4
Doncaster
6.1
Calderdale
5.4
North Yorkshire
5.2
East Riding of Yorkshire
3.0
Local Authority
Incidents per 1,000 people (2025)
Rugby
36.7
Sandwell
35.4
Telford and Wrekin
29.7
Redditch
25.7
Walsall
22.3
Stoke-on-Trent
21.8
Birmingham
20.8
Tamworth
19.6
Coventry
19.5
Solihull
18.1
Warwick
17.6
Bromsgrove
15.6
North Warwickshire
15.2
Nuneaton and Bedworth
15.1
Wolverhampton
11.9
East Staffordshire
11.3
South Staffordshire
10.2
Dudley
10.0
Wyre Forest
8.0
Wychavon
6.9
Newcastle-under-Lyme
6.6
Shropshire
5.2
Lichfield
4.9
Worcester
4.8
Cannock Chase
4.6
Staffordshire Moorlands
4.1
Herefordshire
3.7
Malvern Hills
3.6
Stratford-on-Avon
3.6
Stafford
3.2
Local Authority
Incidents per 1,000 people (2025)
Great Yarmouth
76.8
Luton
48.5
Peterborough
46.8
Norwich
38.3
Stevenage
33.3
Basildon
32.1
Harlow
25.9
Epping Forest
25.8
Welwyn Hatfield
24.7
Colchester
21.7
Huntingdonshire
18.7
Thurrock
16.8
Brentwood
15.7
Fenland
15.6
Cambridge
14.5
Broxbourne
14.0
Watford
12.6
Southend-on-Sea
12.0
Dacorum
11.8
Kings Lynn and West Norfolk
11.7
Castle Point
10.8
Bedford
10.2
North Hertfordshire
10.1
Hertsmere
9.9
Central Bedfordshire
9.6
East Suffolk
8.6
Rochford
7.4
Broadland
6.6
St Albans
6.1
Ipswich
6.0
Breckland
5.7
Maldon
5.5
South Cambridgeshire
5.5
Braintree
4.9
East Hertfordshire
4.9
Three Rivers
4.7
East Cambridgeshire
4.7
Babergh
4.4
Mid Suffolk
4.0
South Norfolk
3.8
North Norfolk
3.7
Uttlesford
3.7
Chelmsford
3.4
Tendring
3.2
West Suffolk
1.5
Local Authority
Incidents per 1,000 people (2025)
Southampton
47.1
Oxford
31.2
Gravesham
23.3
Medway
21.4
Reigate and Banstead
21.1
Folkestone and Hythe
19.6
Canterbury
18.6
Crawley
18.5
Thanet
18.1
Runnymede
17.9
Hastings
16.8
Swale
16.8
Slough
16.8
Maidstone
15.0
Woking
14.2
Basingstoke and Deane
14.0
Milton Keynes
13.9
Hart
13.7
Dartford
13.6
Reading
12.2
Wokingham
11.1
Spelthorne
11.0
Tandridge
10.7
Eastbourne
10.6
Elmbridge
10.3
Ashford
10.3
Sevenoaks
10.2
Havant
9.8
Horsham
9.7
East Hampshire
9.5
Rother
9.1
Guildford
8.6
Test Valley
8.4
Adur
8.4
West Oxfordshire
8.1
Rushmoor
7.9
Dover
7.9
Cherwell
7.8
New Forest
7.7
Tonbridge and Malling
7.6
Mole Valley
7.3
Buckinghamshire
7.3
Surrey Heath
7.0
Arun
6.5
Chichester
6.3
West Berkshire
6.3
Isle of Wight Council
5.8
Brighton and Hove
5.7
Windsor and Maidenhead
5.7
Epsom and Ewell
5.4
Winchester
5.4
Waverley
5.3
Tunbridge Wells
5.3
Lewes
4.9
Gosport
4.7
Bracknell Forest
4.6
Worthing
4.6
Portsmouth
4.4
South Oxfordshire
4.2
Wealden
3.6
Eastleigh
3.3
Mid Sussex
2.9
Vale of White Horse
2.9
Fareham
2.7
Local Authority
Incidents per 1,000 people (2025)
Bristol
20.8
Plymouth
19.7
Swindon
15.4
Forest of Dean
14.5
Bournemouth, Christchurch and Poole
12.1
Torbay
11.1
Gloucester
11.0
Bath and North East Somerset
10.3
Cotswold
10.1
North Somerset
9.9
Cheltenham
9.9
Stroud
9.8
Exeter
8.1
Teignbridge
7.6
South Hams
7.2
South Gloucestershire
7.1
Tewkesbury
6.8
Cornwall
6.7
West Devon
5.8
Mid Devon
5.7
Wiltshire
5.7
North Devon
5.7
Somerset
4.8
Torridge
3.9
Dorset
3.6
East Devon
2.5
Isles of Scilly
0.0
Our local authority breakdown reveals just how sharply fly-tipping is concentrated in certain hotspots, even within regions. London boroughs such as Camden (166.9) and Croydon (130.1) report significantly higher rates than areas such as Kingston Upon Thames (13.8), which shows such variation in just one city. More rural areas, however, report much lower rates, for example, North Yorkshire (5.2), East Devon (2.5) and West Suffolk (1.5).
Rural vs Urban incidents
Fly-tipping looks different in rural and urban areas across England however, both are hard hit. In urban areas, incidents are often small-scale dumping of black bin bags (such as we covered in our questions to the public), or furniture left in back alleys. These incidents can dramatically affect the quality of life for the communities living around them, while also posing public health risks, attracting rodents and placing even a greater economic burden on local councils.
In rural areas, by contrast, fly-tipping often involves large loads dumped onto country lanes, farm tracks and private land, disappointingly affecting farmers and landowners who are usually responsible for clearing this illegal waste, which may contaminate the land and water around it.
We analysed the latest fly‑tipping figures from Defra and categorised all 295 local authorities as either rural or urban to see where illegal dumping is most prevalent and how the problem differs between the two. Urban areas overwhelmingly dominate. The top 75 local authorities who have reported the most incidents are all urban. The first area classified as rural to enter the ranking is Folkestone and Hythe at joint 76th, which has reported 19.6 incidents per 1,000 people during the year 2025.
The following tables show the top 10 local authorities by rural and urban areas ranked by reported incidents:
Urban areas
Rank
Local authority
Region
Incidents per 1,000 people (2025)
1
Camden
London
166.9
2
Croydon
London
130.1
3
Hackney
London
116.4
4
Lewisham
London
111.1
5
City of London
London
109.5
6
Westminster
London
95.5
7
Hounslow
London
84.1
8
Nottingham
East Midlands
78.9
9
Great Yarmouth
East
76.8
10
Newham
London
70.8
Rural areas
Rank
Local authority
Region
Incidents per 1,000 people (2025)
1
Folkestone and Hythe
South East
19.6
2
Huntingdonshire
East
18.7
3
South Holland
East Midlands
17.6
4
West Lancashire
North West
17.4
5
West Lindsey
East Midlands
15.3
6
North Warwickshire
West Midlands
15.2
7
Forest of Dean
South West
14.5
8
Bolsover
East Midlands
14.3
9
Bassetlaw
East Midlands
14.2
10
Newark and Sherwood
East Midlands
12.9
London boroughs dominate the rankings, with eight of the 10 local authorities falling within the capital. Incidents across all urban areas within the top 10 reach above 70 incidents per 1,000 people, which is startling when comparing these figures to rural areas which at most, report just under 20 (19.6) incidents per 1,000 people.
On the rural side, councils in the East Midlands account for half of the top ten authorities reporting the highest number of incidents, while West Lancashire is the only council from the North to feature.
Communities impacted by fly-tipping
Proviso:
For the purpose of this analysis, councils described as ‘deprived’ have been identified using the Government’s Index of Multiple Deprivation (IMD) rank. This rank combines factors including income, employment, health, education, crime, access to services and living environment to provide an overall measure of relative deprivation.
So far, we have explored how fly-tipping isn’t just the issue of one area of the country or group, however, that isn’t to say certain communities aren’t disappointedly affected. Keep Britain Tidy’s report: A Rubbish Reality, highlights this divide. Combining on-the-ground observations with public polling, the report has found:
In the most deprived areas of the country, just 2% of places were litter-free compared with 14% in the least deprived areas. In practice, this means surveyors are seven times more likely to find a litter-free space in the most deprived areas
Seven in 10 people (71%) living in the most deprived areas agree that litter is a problem where they live, falling to just over half (56%) for those living in the least deprived areas
When viewing this report alongside the latest fly-tipping data from Defra, a more complex picture emerges. While deprivation levels can correlate to higher incidents of fly-tipping as seen particularly in London boroughs such as Hackney (116.4) and Newham (70.8), the data does not point to a consistent pattern across all deprived local communities. In contrast, a clearer trend can be seen among the top 10 more affluent areas, where incidents tend to be lower:
Top 10 local authorities experiencing higher rates of deprivation
Index of Multiple Deprivation (IMD) Rank
Local authority
Region
Area type
Incidents per 1,000 people (2025)
Average band D council tax
1
Blackpool
North West
Urban
35.0
£2,513.22
2
Manchester
North West
Urban
25.4
£2,312.04
3
Hastings
South East
Urban
16.8
£2,676.58
4
Burnley
North West
Urban
42.4
£2,560.30
5
Sandwell
West Midlands
Urban
35.4
£2,133.45
6
Leicester
East Midlands
Urban
17.9
£2,528.75
7
Newham
London
Urban
70.8
£1,944.23
8
Birmingham
West Midlands
Urban
20.8
£2,353.17
9
Barking and Dagenham
London
Urban
32.7
£2,198.50
10
Hackney
London
Urban
116.4
£2,060.30
Top 10 local authorities experiencing lower rates of deprivation
Index of Multiple Deprivation (IMD) Rank
Local authority
Region
Area type
Incidents per 1,000 people (2025)
Average band D council tax
296
Hart
South East
Urban
13.7
£1,855.53
295
Wokingham
South East
Urban
11.1
£2,027.40
294
Rushcliffe
East Midlands
Rural
8.6
£2,531.51
293
Epsom and Ewell
South East
Urban
5.4
£2,308.34
292
Elmbridge
South East
Urban
10.3
£2,556.87
291
Fareham
South East
Urban
2.7
£2,164.55
290
Surrey Heath
South East
Urban
7.0
£2,626.59
289
Waverley
South East
Urban
5.3
£2,484.13
288
St Albans
East
Urban
6.1
£2,435.17
287
South Oxfordshire
South East
Rural
4.2
£2,474.00
Fly-tipping puts serious economic pressure on local authorities, so we wanted to understand whether some of that cost is passed onto local residents. To investigate, we pulled the latest available figures for Band D council tax for every 295 council to see if there is a correlation between higher levels of council tax and fly-tipping incidents.
The 10 local authorities charging the most average council tax
Rank
Local authority
Region
Area type
Incidents per 1,000 people (2025)
Index of Multiple Deprivation (IMD) Rank
Average band D council tax
1
Gateshead
North East
Urban
25.8
58
£2,715.52
2
Bristol
South West
Urban
20.8
123
£2,713.68
3
Ashfield
East Midlands
Urban
7.8
75
£2,693.30
4
Oxford
South East
Urban
31.2
217
£2,692.47
5
Wealden
South East
Rural
3.6
238
£2,690.02
6
Hastings
South East
Urban
16.8
3
£2,676.58
7
Rutland
East Midlands
Rural
5.2
272
£2,670.21
8
Mid Devon
South West
Rural
5.7
126
£2,656.41
9
Nottingham
East Midlands
Urban
78.9
18
£2,656.19
10
Eastbourne
South East
Urban
10.6
96
£2,654.28
The 10 local authorities charging the least average council tax
Rank
Local authority
Region
Area type
Incidents per 1,000 people (2025)
Index of Multiple Deprivation (IMD) Rank
Average band D council tax
1
Westminster
London
Urban
95.5
87
£1,017.18
2
Wandsworth
London
Urban
16.5
193
£1,020.35
3
City of London
London
Urban
109.5
267
£1,329.56
4
Hammersmith and Fulham
London
Urban
42.9
108
£1,451.42
5
Kensington and Chelsea
London
Urban
52.7
130
£1,643.44
6
East Hertfordshire
East
Urban
4.9
276
£1,755.18
7
Tower Hamlets
London
Urban
18.2
20
£1,837.78
8
Hart
South East
Urban
13.7
296
£1,855.53
9
Bromley
London
Urban
20.8
248
£1,902.26
10
South Gloucestershire
South West
Urban
7.1
253
£1,931.33
Like much of the data in this report, the findings paint a mixed picture. There is no consistent relationship between how much residents pay in council tax and the scale of fly-tipping in their area, and there is also limited transparency on how much local authorities actually charge for fly-tipping clean-ups. This makes it difficult to draw firm conclusions about the financial burden on residents. Instead, the data suggests that factors such as urban density, local behaviours, and public awareness play a far more significant role; insights which lead us to examine how fines are issued and enforced across councils.
Fines enforcement and prosecution in England
According to Defra, in 2024/25, there were 572,000 enforcement actions carried out across England for fly-tipping, an increase in 8% compared to the previous year.
Prosecution outcomes for offences show consistently high success rates, with an almost 100% success rate (99.1%) for the year 2024/25. Fines remain the most consistent penalty; however, their use has declined over time, falling from 1,659 in 2018/19 to 1,250 in 2024/25.
Alongside this, the government is introducing new powers as part of their Waste Crime Action Plan that will allow councils to issue conditional cautions, forcing fly-tippers to join ‘clean up squads’ for up to 20 hours of unpaid work at dump sites, without the need for court proceedings. Furthermore, councils will also have the power to seize offenders’ funds to cover clean-up costs. We caught up with our Group Chief Commercial Officer, Kelvin Croney, again to understand whether he feels this will be effective in tackling the issue:
“The new proposal from the Government is a step forward in tackling fly-tipping, however, this won’t solve the issue overnight. Stronger regulation combined with greater awareness among businesses and residents is essential, and it is only through a collective effort that we will really see the issue addressed.”
– Kelvin Croney, Group Chief Commercial Officer – Waste Managed
Year
Fines issued
Absolute or conditional discharge
Other (successful outcomes)
Community service
Custodial sentence
Cases lost
Total prosecutions
Successful prosecutions
2018/19
1659
80
109
40
26
101
2005
95.0%
2019/20
1657
58
95
44
41
50
1930
97.4%
2020/21
621
33
36
15
5
25
721
96.5%
2021/22
1798
56
63
30
20
37
1960
98.1%
2022/23
1491
55
58
34
21
46
1681
97.3%
2023/24
1378
56
78
22
28
47
1598
97.1%
2024/25
1250
31
37
37
13
13
1377
99.1%
England’s fly-tipping crisis persists despite residents knowing the impact on communities, the environment and even their own liberty. The data we have presented in this report shows just how complex the issue is, with no party clearly responsible and no one size fits all solution. What is clear, however, is that fly-tipping is a harmful crime that significantly affects the quality of life for those living nearby and the local ecosystems it pollutes. It is a serious issue, but progress is possible. By raising awareness of both small and large-scale actions and with support from individual residents, local communities and governments alike, we can look towards reducing this crime. Together, we can pave the way for a cleaner future for all.
Preventing fly-tipping starts with proper disposal, which is critical if you are running a business. We offer environmentally friendly waste collection services at an affordable fixed monthly price, and you can be assured that everything is properly handled. From confidential waste to clinical and medical waste, we help businesses do their part against fly-tipping.
Methodology
The research for our public opinion poll was conducted by Censuswide, among a sample of 2,000 nationally representative general respondents (aged 18+). The data was collected between 11.03.2026 – 13.03.2026. Censuswide abides by and employs members of the Market Research Society and follows the MRS code of conduct and ESOMAR principles. Censuswide is also a member of the British Polling Council.
The rest of the data presented and analysed in this report has been sourced via:
UK Government: Deprivation in England – 2025 Index of Multiple Deprivation. Note there is no IMD rank for Kingston upon Hull despite this local authority appearing in the Defra fly-tipping data we have presented. We have removed this area when discussing deprivation rates.
Average band D council tax: Local authority websites, with the latest figures sourced from the 9th – 18th March 2026. Where we could not source data from local authority websites, we deferred to Homenicom, a comprehensive hub for property insights.
Classification of rural vs urban areas: RUC of local authority districts. We then applied our own grouping to simplify areas into two categories (rural, urban) from the four Government categories (urban, immediate urban, intermediate rural, majority rural).
Lyndsay Close – Head of Marketing
Lyndsay joined Waste Managed in April 2025 and brings with her a wealth of marketing knowledge. With degrees in Advertising, Marketing, and Digital Marketing, and being an Associate Member of CIM, Lyndsay is passionate about sustainability, storytelling, and delivering customer excellence.